
Tradingview Pro Indicators
Zero To Hero Indicator
Zero To Hero Indicator
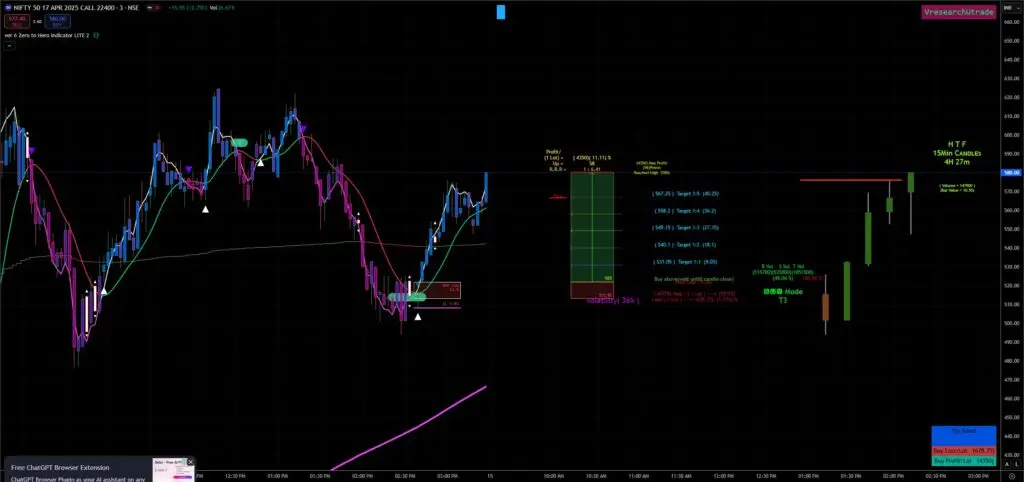
The Zero To Hero Setup is a sophisticated trading indicator created to assist both beginners and experienced traders alike. It encapsulates a variety of essential trading metrics designed to streamline and simplify the trading process. Below is an elaborate breakdown of its key features such as
- Stop Loss: Helps limit potential losses.
- Profit Targets: Shows potential profit levels.
- Capital Management: Assists in managing trading funds.
- Stop Loss Amount: Indicates potential losses.
- Multiple Targets: Provides clear exit points.
- Trailing Stop Loss
This indicator is built using moving averages, making it reliable for identifying trends and potential trading opportunities. Its simplicity and visual clarity make it accessible to newcomers, while its depth of information supports advanced trading strategies. It’s a one-stop solution for traders looking to manage risk and optimize their trading decisions effectively.
Optimize indicator settings
It is very important that you adjust and optimize the indicator settings. Each financial instrument has its own rhythm, so you need to adjust and fine-tune settings to optimize the trading signals. You can tune and tweak the indicator settings to improve signal generation accuracy. You also need to test different time frames and instrument types as this will help you optimize the signals. Settings can sometimes be very individual, depending on your trading style and time frame used.
Backtesting
Backtesting refers to applying a trading system to historical data in order to verify how a system would have performed during the specified time period and with the current data sample. Backtesting and optimizing provide many benefits to a trader, but this is only part of the process when creating a trading system or strategy. You also have to use forward testing and live trading.
Over the couple months, we have tested all our algorithms and indicators across a wide range of instruments and timeframes to ensure maximum and optimal performance. The results vary slightly, depending upon instrument type and timeframe used, but overall, this indicator has a very high average success ratio on all instruments tested. We have also successfully performed forward testing when developing the algorithms, posting high win-rates. During the last 12 months, we have also used the indicators ourselves when trading live, and with great results.
Get Started today. Never miss another trade!
Pricing & Plans
FREE DEMO
- One Indicator
- Zero to Hero Indicator
MONTHLY PLAN
- One Indicator
- Zero to Hero Indicator
3 MONTHS PLAN
- One Indicator
- Zero to Hero Indicator
Stop Loss Based Multi Time Frame Setup
Zero To Hero Setup
Multi-Time Frame Setup in Trading
The Zero To Hero Setup is a sophisticated trading indicator created to assist both beginners and experienced traders alike. It encapsulates a variety of essential trading metrics designed to streamline and simplify the trading process. Below is an elaborate breakdown of its key features and functionalities:
Multi-time frame trading is a strategy where traders analyze securities across multiple time frames to improve decision-making and enhance their trading outcomes. The principle behind this method is to obtain a comprehensive view of the market’s behavior by examining the same asset on different time frames, which helps in understanding trends and making more informed trading decisions.
Definition of Multi – Time Frame Setup
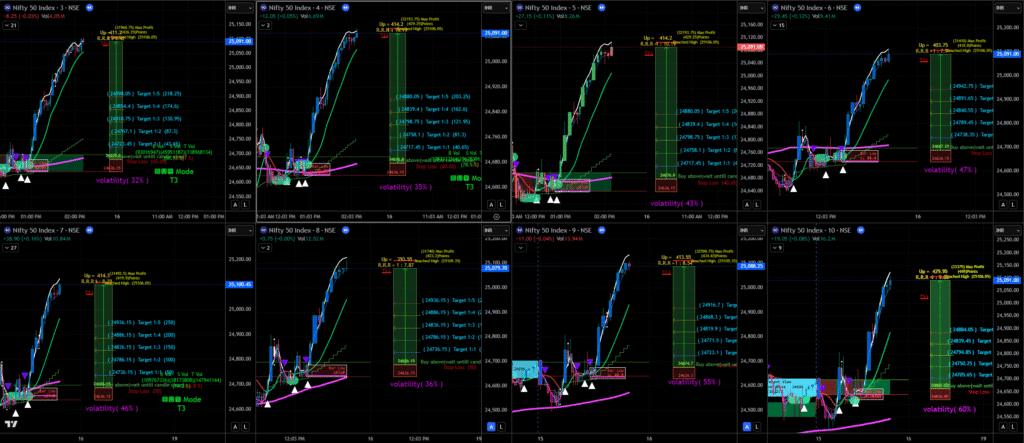
A multi-time frame (MTF) setup in trading involves analyzing the same asset across different time frames to make informed trading decisions. This approach helps traders capture trends, identify price levels of significance, and refine entry and exit points.
Indicator Utilization
In this setup, we are utilizing an indicator that displays essential metrics across various time frames: 3, 5, 7, 9, 11, 4, 6, 8, 10, and 12 minutes. This broad range of time frames enables you to observe price movements and volatility across both short and slightly longer periods.
The metrics provided by your indicator play a crucial role in this multi-time frame strategy:
Stop Loss: A fixed range stop loss is applied across all time frames, which maintains consistency in risk management.
Capital Requirement and Margin: The indicator shows required capital and margin needed for trades, which allows for precise financial planning.
CPR and ORB Range Values: These metrics help in identifying critical price levels where entries and exits can be more strategically planned.
Risk-Reward Ratio Targets: The indicator calculates potential profits relative to the stop loss, guiding you on potential trade setups that meet your profit expectations.
Volatility Value: Understanding volatility across time frames aids in recognizing moments of higher market activity or calm, helping to time your trades effectively.
Points Increased/Decreased: This offers insight into market momentum—whether there’s a bullish or bearish sentiment based on how many points the asset has moved in either direction.
Volume Metrics: High volume at the point of a signal can validate trade decisions, suggesting a stronger move in the intended direction.
Trading Strategy
Top-Down Analysis: This approach dictates starting analysis with higher time frames for trend direction before moving down to lower time frames for specific trade opportunities. For instance, with your selected time frames, you might start by looking for overall trends in the 11-minute and 12-minute charts before making decisions based on the signals in the 3-minute or 5-minute charts.
Entry and Exit Timing: Utilize the lower time frames (like 3 or 4 minutes) to refine our entry and exit points based on the indication of market movements and trends observed in higher time frames (like 10 or 12 minutes). This helps in ensuring that trades are not only made in the direction of the trend but also executed at optimal points for maximum potential gain.
Risk Management: With a fixed stop-loss approach across different time frames, you ensure that your maximum risk per trade remains proportional to your account size, irrespective of the time frame you are examining. This consistent approach helps in psychological comfort and financial discipline.
Evaluating Trade Validity: The volume shown at signal points will aid in confirming whether the trade is valid, thus influencing the likelihood of success. If volume is high when a trading signal occurs, this usually indicates stronger market consensus.
Review and Adaptation: Regularly reviewing your multi-time frame analysis will help adapt to shifting market conditions, enhancing decision-making. Engaging with various time frames keeps you updated on potential shifts in the market sentiment or volatility.
Multi-Time Frame Analysis
The strategy typically utilizes a top-down approach:
Higher Time Frames: Used to identify the overall market trend, setting a directional bias (bullish, bearish, or neutral).
Lower Time Frames: These serve to pinpoint specific entry and exit opportunities that align with the established bias from the higher time frame.
Advantages of Multi-Time Frame Analysis
Enhanced Decision Making: By correlating data from different time frames, traders can make more informed decisions.
Improved Timing: Better alignment of trades with significant market movements, refining entry and exit points.
Increased Success Rate: Cross-verifying signals across time frames can reduce the likelihood of false signals and whipsaw trades—this increases the probability of entering successful .
Accessibility & Depth
One of the significant advantages of this indicator is its usability; it is designed with visual clarity, resolving complex trading data into easily comprehensible formats. This allows newcomers to grasp critical concepts quickly while offering sufficient depth and detail for more advanced trading strategies.
Conclusion
Implementing a multi-time frame trading setup requires careful analysis of indicators, understanding the underlying market movements, and maintaining a disciplined approach to risk management. By utilizing the metrics provided by our indicator and following a structured trading strategy, you can potentially enhance trading effectiveness while managing risks effectively.
Optimize indicator settings
It is very important that you adjust and optimize the indicator settings. Each financial instrument has its own rhythm, so you need to adjust and fine-tune settings to optimize the trading signals. You can tune and tweak the indicator settings to improve signal generation accuracy. You also need to test different time frames and instrument types as this will help you optimize the signals. Settings can sometimes be very individual, depending on your trading style and time frame used.
Backtesting
Backtesting refers to applying a trading system to historical data in order to verify how a system would have performed during the specified time period and with the current data sample. Backtesting and optimizing provide many benefits to a trader, but this is only part of the process when creating a trading system or strategy. You also have to use forward testing and live trading.
Over the couple months, we have tested all our algorithms and indicators across a wide range of instruments and timeframes to ensure maximum and optimal performance. The results vary slightly, depending upon instrument type and timeframe used, but overall, this indicator has a very high average success ratio on all instruments tested. We have also successfully performed forward testing when developing the algorithms, posting high win-rates. During the last 12 months, we have also used the indicators ourselves when trading live, and with great results.
Get Started today. Never miss another trade!
Pricing & Plans
FREE DEMO
- One Indicator
- Zero to Hero Indicator
- Dynamic Divergence Indicator
- HTF Trend Line Indicator
- List Item
MONTHLY PLAN
- 3 Indicators
- Zero to Hero Indicator
- HTF Trend Line Indicator
- Dynamic Divergence Indicator
3 MONTHS PLAN
- 3 Indicators
- Zero to Hero Indicator
- Dynamic Divergence Indicator
- HTF Trend Line Indicator
Scalping Indicator
Scalping Indicator
This scalping indicator is a specialized tool used by traders to identify short-term trading opportunities for quick profits. It’s designed for scalping strategies, which involve making numerous trades throughout the day to capitalize on small price movements.
Key Features:
- Rapid Signals: Provides quick buy and sell signals, allowing traders to enter and exit positions within seconds or minutes.
- Trend Identification: Helps identify short-term trends or reversals using technical indicators such as moving averages.
- Precise Entry and Exit Points: Suggests optimal levels for entering and exiting trades to maximize profit potential while minimizing risk.
Benefits for Traders:
- Efficiency: Facilitates fast decision-making in volatile markets, essential for scalping.
- High Probability: Increases the likelihood of successful trades by focusing on high-frequency signals.
- Tight Risk Management: Often includes features for setting stop-loss and take-profit levels to safeguard against excessive losses.
Ideal For:
- Day Traders: Those who aim to profit from small price fluctuations within a single trading day.
- Experienced Traders: Individuals comfortable with quick trades and managing high volume.
This indicators can enhance a trader’s ability to act swiftly in rapidly changing market conditions, making them an invaluable asset for scalpers.
Optimize indicator settings
It is very important that you adjust and optimize the indicator settings. Each financial instrument has its own rhythm, so you need to adjust and fine-tune settings to optimize the trading signals. You can tune and tweak the indicator settings to improve signal generation accuracy. You also need to test different time frames and instrument types as this will help you optimize the signals. Settings can sometimes be very individual, depending on your trading style and time frame used.
Backtesting
Backtesting refers to applying a trading system to historical data in order to verify how a system would have performed during the specified time period and with the current data sample. Backtesting and optimizing provide many benefits to a trader, but this is only part of the process when creating a trading system or strategy. You also have to use forward testing and live trading.
Over the couple months, we have tested all our algorithms and indicators across a wide range of instruments and timeframes to ensure maximum and optimal performance. The results vary slightly, depending upon instrument type and timeframe used, but overall, this indicator has a very high average success ratio on all instruments tested. We have also successfully performed forward testing when developing the algorithms, posting high win-rates. During the last 12 months, we have also used the indicators ourselves when trading live, and with great results.
Get Started today. Never miss another trade!
Pricing & Plans
FREE DEMO
- One Indicator
- Scalping Indicator
MONTHLY PLAN
- One Indicator
- Scalping Indicator
3 MONTHS PLAN
- One Indicator
- Scalping Indicator
Scalping Setup
Scalping Indicator Setup
Indicator Overview
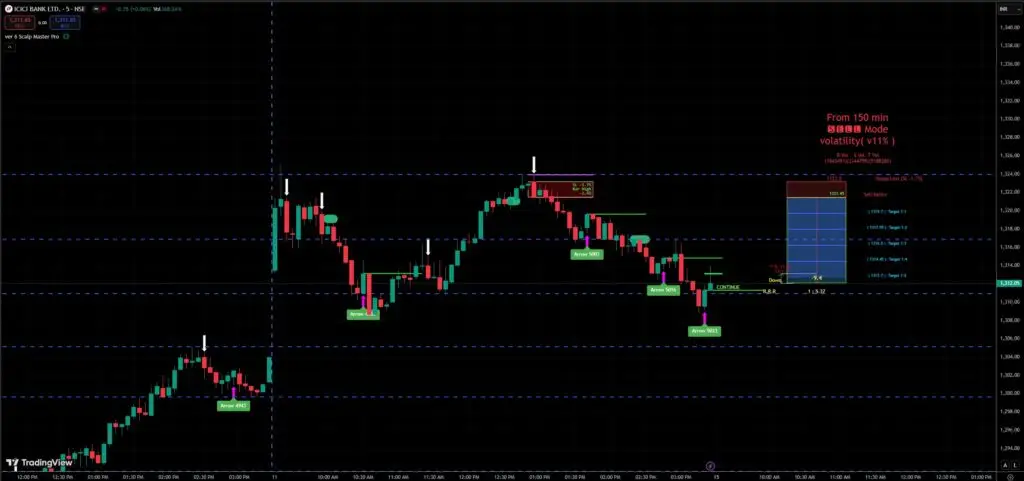
A sophisticated trading tool engineered for precise, multi-timeframe scalping strategies across 1sec to 15-minute intervals, designed to capture micro-market movements with enhanced accuracy. It’s designed for scalping strategies, which involve making numerous trades throughout the day to capitalize on small price movements.
Key Features:
- Rapid Signals: Provides quick buy and sell signals, allowing traders to enter and exit positions within seconds or minutes.
- Trend Identification: Helps identify short-term trends or reversals using technical indicators such as moving averages.
- Precise Entry and Exit Points: Suggests optimal levels for entering and exiting trades to maximize profit potential while minimizing risk.
Benefits for Traders:
- Efficiency: Facilitates fast decision-making in volatile markets, essential for scalping.
- High Probability: Increases the likelihood of successful trades by focusing on high-frequency signals.
- Tight Risk Management: Often includes features for setting stop-loss and take-profit levels to safeguard against excessive losses.
Ideal For:
- Day Traders: Those who aim to profit from small price fluctuations within a single trading day.
- Experienced Traders: Individuals comfortable with quick trades and managing high volume.
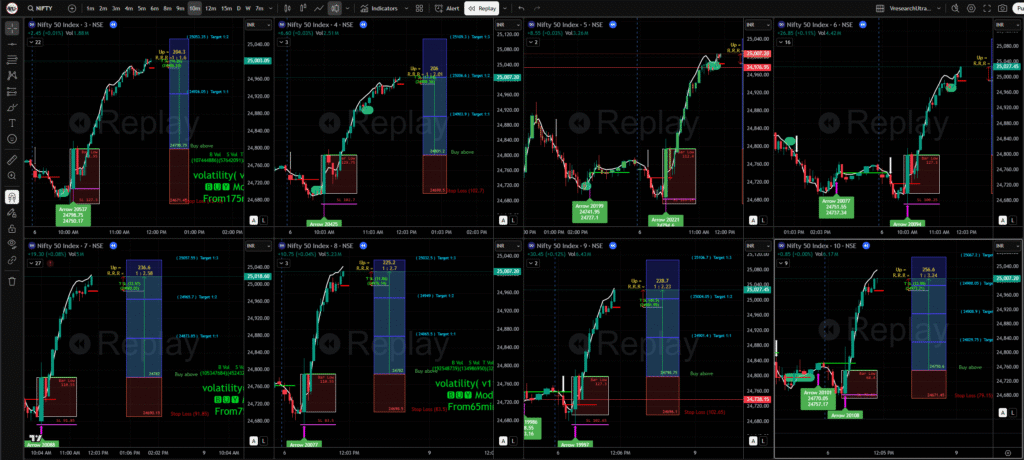
Multi-Timeframe : Comprehensive Strategy Guide
Advanced Technical Specifications
Timeframe Configurations
- Primary Timeframes: 1, 3, 5, 7, 10, 15 minutes
- Adaptive Signal Generation: Cross-timeframe confirmation mechanism
- Dynamic Interval Scanning: Simultaneous analysis across selected timeframes
Signal Generation Mechanisms
- Rapid Signal Identification
- Real-time trend detection
- Multi-layer confirmation setup
- Trend Identification Modules
- Exponential Moving Averages (EMA)
- Relative Strength Index (RSI)
Risk Management Features
- Automatic stop-loss calculation
- Position sizing recommendations
Trader Optimization Strategies
Entry Criteria
- Minimum signal confidence: 70%
- Confirmed trend across multiple timeframes
- Volatility-based entry point validation
- Momentum confluence check
Exit Strategies
- Trailing stop-loss
- Profit target based on Average True Range (ATR)
- Quick exit on trend reversal signals
Risk Management Principles
- Position Sizing
- Maximum risk per trade: 1-2% of total capital
- Adaptive position sizing based on market volatility
- Position reduction during high-uncertainty periods
- Capital Preservation
- Maintain drawdown protection
- Trading suspension during extreme market conditions
- Risk adjustment practice
Ideal Trader Profile
- Skill Level: Intermediate to Advanced
- Required Attributes:
- Quick decision-making capabilities
- Strong emotional discipline
- Technical analysis understanding
- High-speed internet connection
- Professional trading platform access
Recommended Trading Instruments
- Highly liquid markets
- Low spread instruments
- Technology sector stocks
- Index futures, Options and Stocks
Technological Requirements
- High-performance computer
- Low-latency internet connection
- Professional trading platform
- Real-time data feed
- Fast execution experience
Continuous Improvement
- Regular strategy backtesting
- Performance benchmarking
Disclaimer
⚠️ Scalping involves high risk. Extensive practice, simulation, and continuous learning are crucial for successful implementation.
Optimize indicator settings
It is very important that you adjust and optimize the indicator settings. Each financial instrument has its own rhythm, so you need to adjust and fine-tune settings to optimize the trading signals. You can tune and tweak the indicator settings to improve signal generation accuracy. You also need to test different time frames and instrument types as this will help you optimize the signals. Settings can sometimes be very individual, depending on your trading style and time frame used.
Backtesting
Backtesting refers to applying a trading system to historical data in order to verify how a system would have performed during the specified time period and with the current data sample. Backtesting and optimizing provide many benefits to a trader, but this is only part of the process when creating a trading system or strategy. You also have to use forward testing and live trading.
Over the couple months, we have tested all our algorithms and indicators across a wide range of instruments and timeframes to ensure maximum and optimal performance. The results vary slightly, depending upon instrument type and timeframe used, but overall, this indicator has a very high average success ratio on all instruments tested. We have also successfully performed forward testing when developing the algorithms, posting high win-rates. During the last 12 months, we have also used the indicators ourselves when trading live, and with great results.
Get Started today. Never miss another trade!
Pricing & Plans
FREE DEMO
- 3 Indicators
- Scalping Setup
- Dynamic Divergence Indicator
- HTF Trend Line Indicator
MONTHLY PLAN
- 3 Indicators
- Scalping Setup
- Dynamic Divergence Indicator
- HTF Trend Line Indicator
3 MONTHS PLAN
- 3 Indicators
- Scalping Setup
- Dynamic Divergence Indicator
- HTF Trend Line Indicator
Divergence, Dynamic supp & Res Indicator

Divergence Indicator
Dynamic Support and Resistance:
- Automatically adjusts to changing price levels.
- Helps traders identify key areas where prices may reverse or consolidate.
Divergence Signals:
- Highlights discrepancies between price action and indicators (like RSI or MACD).
- Signals potential trend reversals, aiding in timely entry and exit points.
Moving Averages:
- Provides trend direction and smoothing of price data.
- Useful for identifying short-term and long-term trends quickly.
Demand and Supply Zones:
- Identifies key price levels where buying (demand) and selling (supply) pressure is concentrated.
- Helps traders recognize where to enter (demand) or exit (supply) positions.
Benefits for Traders:
- Comprehensive Analysis: Combines multiple analytical tools for a well-rounded market view.
- Improved Decision-Making: Facilitates more informed trading strategies by visualizing critical price levels and trends.
- Versatility: Suitable for both beginners and experienced traders, accommodating various trading styles.
This indicator serves as a powerful asset for traders looking to navigate the markets with greater precision and confidence.
Optimize indicator settings
It is very important that you adjust and optimize the indicator settings. Each financial instrument has its own rhythm, so you need to adjust and fine-tune settings to optimize the trading signals. You can tune and tweak the indicator settings to improve signal generation accuracy. You also need to test different time frames and instrument types as this will help you optimize the signals. Settings can sometimes be very individual, depending on your trading style and time frame used.
Backtesting
Backtesting refers to applying a trading system to historical data in order to verify how a system would have performed during the specified time period and with the current data sample. Backtesting and optimizing provide many benefits to a trader, but this is only part of the process when creating a trading system or strategy. You also have to use forward testing and live trading.
Over the couple months, we have tested all our algorithms and indicators across a wide range of instruments and timeframes to ensure maximum and optimal performance. The results vary slightly, depending upon instrument type and timeframe used, but overall, this indicator has a very high average success ratio on all instruments tested. We have also successfully performed forward testing when developing the algorithms, posting high win-rates. During the last 12 months, we have also used the indicators ourselves when trading live, and with great results.
Get Started today. Never miss another trade!
Pricing & Plans
FREE DEMO
- One Indicator
- Dynamic Divergence Indicator
MONTHLY PLAN
- One Indicator
- Dynamic Divergence Indicator
3 MONTHS PLAN
- One Indicator
- Dynamic Divergence Indicator
HTF Trend Line Indicator

HTF Trend Line Indicator
This trading indicator is a powerful tool designed to help traders make informed decisions by combining moving averages, demand and supply zones, and trend line breakouts. Here’s a concise breakdown of its features and benefits:
Key Features:
Moving Averages:
- Tracks the trend direction by smoothing out price fluctuations.
- Provides insights into the overall market direction (uptrend, downtrend, or consolidation).
- Helps identify potential buy and sell signals based on crossover points or deviations.
Demand and Supply Zones:
- Identifies areas of strong buying (demand zones) and selling (supply zones).
- These zones act as dynamic support and resistance levels.
- Helps traders locate optimal entry and exit points.
Trend Line Breakouts on Multiple Time Frames:
- Higher Time Frames Trend lines monitor on Lower time Frame Charts (e.g., 3 or 5-Min charts).
- Alerts traders when a breakout occurs on the higher time frame.
- Displays these higher time frame breakout signals on lower time frames (e.g., 15-minute or 1-hour charts) for precise execution.
- This ensures traders are aligned with the broader market trend while executing trades on smaller time frames.
Benefits for Traders:
- Trend Clarity: Moving averages and trend lines help traders understand the dominant market trend.
- Precision Entries/Exits: Demand and supply zones guide traders to enter or exit trades at favorable price levels.
- Multi-Time Frame Strategy: By showing higher time frame signals on lower time frames, it allows traders to align their strategies with the overall market direction, reducing false signals and improving accuracy.
- Risk Management: The integration of supply and demand zones, along with trend line breakouts, assists in setting stop-loss and take-profit levels effectively.
Ideal For:
- Scalpers: To capitalize on short-term price movements.
- Swing Traders: To ride the trend confirmed by higher time frames.
- Day Traders: To execute trades with precision using dynamic support and resistance levels.
This indicator is a versatile tool that simplifies trading by providing actionable insights. It’s especially useful for traders who want to combine trend-following and supply-demand strategies.
Optimize indicator settings
It is very important that you adjust and optimize the indicator settings. Each financial instrument has its own rhythm, so you need to adjust and fine-tune settings to optimize the trading signals. You can tune and tweak the indicator settings to improve signal generation accuracy. You also need to test different time frames and instrument types as this will help you optimize the signals. Settings can sometimes be very individual, depending on your trading style and time frame used.
Backtesting
Backtesting refers to applying a trading system to historical data in order to verify how a system would have performed during the specified time period and with the current data sample. Backtesting and optimizing provide many benefits to a trader, but this is only part of the process when creating a trading system or strategy. You also have to use forward testing and live trading.
Over the couple months, we have tested all our algorithms and indicators across a wide range of instruments and timeframes to ensure maximum and optimal performance. The results vary slightly, depending upon instrument type and timeframe used, but overall, this indicator has a very high average success ratio on all instruments tested. We have also successfully performed forward testing when developing the algorithms, posting high win-rates. During the last 12 months, we have also used the indicators ourselves when trading live, and with great results.
Get Started today. Never miss another trade!
Pricing & Plans
FREE DEMO
- One Indicator
- HTF Trend Line Indicator
MONTHLY PLAN
- One Indicator
- HTF Trend Line Indicator
3 MONTHS PLAN
- One Indicator
- HTF Trend Line Indicator
Dynamic supp & Res Indicator

Dynamic support & Resistance Indicator
This indicator is a powerful trading tool designed to help traders identify key market levels and trends. It combines the following features to provide actionable insights:
Support and Resistance Levels:
- Highlights areas where price tends to pause or reverse due to buying or selling pressure.
Trend Lines:
- Draws lines to identify the direction and strength of the current trend.
Demand and Supply Zones:
- Demand Zone: A price area where buying pressure is strong enough to halt a downtrend or reverse it.
- Supply Zone: A price area where selling pressure is strong enough to halt an uptrend or reverse it.
Trend Line Breakout Signals:
- Alerts traders when the price breaks above or below a trend line, indicating a potential trend reversal or continuation.
How It Works:
- The indicator identifies support/resistance and demand/supply zones to pinpoint where buyers and sellers are most active.
- It draws trend lines to visualize the direction of the market and detects breakouts, which often signal shifts in market sentiment.
Benefits for Traders:
- Helps identify entry and exit points with precision.
- Alerts traders to potential trend reversals or continuations through trendline breakouts.
- Combines technical analysis tools (support/resistance, trend lines) with market sentiment analysis (demand/supply zones) for a complete view of market dynamics.
This indicator is a versatile tool for traders looking to trade confidently by identifying key levels and trends. It works well for both beginners and experienced traders.
Optimize indicator settings
It is very important that you adjust and optimize the indicator settings. Each financial instrument has its own rhythm, so you need to adjust and fine-tune settings to optimize the trading signals. You can tune and tweak the indicator settings to improve signal generation accuracy. You also need to test different time frames and instrument types as this will help you optimize the signals. Settings can sometimes be very individual, depending on your trading style and time frame used.
Backtesting
Backtesting refers to applying a trading system to historical data in order to verify how a system would have performed during the specified time period and with the current data sample. Backtesting and optimizing provide many benefits to a trader, but this is only part of the process when creating a trading system or strategy. You also have to use forward testing and live trading.
Over the couple months, we have tested all our algorithms and indicators across a wide range of instruments and timeframes to ensure maximum and optimal performance. The results vary slightly, depending upon instrument type and timeframe used, but overall, this indicator has a very high average success ratio on all instruments tested. We have also successfully performed forward testing when developing the algorithms, posting high win-rates. During the last 12 months, we have also used the indicators ourselves when trading live, and with great results.
Get Started today. Never miss another trade!
Pricing & Plans
FREE DEMO
- One Indicator
- Dynamic supp & Res Indicator
MONTHLY PLAN
- One Indicator
- Dynamic supp & Res Indicator
3 MONTHS PLAN
- One Indicator
- Dynamic supp & Res Indicator
Common Mistakes in Trading and How to Avoid Them
Trading can be highly rewarding, but only if approached with discipline and strategy. Many traders make avoidable mistakes that lead to losses. Below is a comprehensive list of common mistakes and ways to overcome them:
1. Lack of a Trading Plan
- Jumping into trades without a clear strategy.
- Not defining entry, exit, and risk management rules.
- Solution: Create and follow a structured trading plan for consistent success.
2. Overtrading
- Taking too many trades without proper analysis.
- Trading impulsively due to emotions like greed or fear.
- Solution: Stick to quality trades instead of quantity and manage emotions carefully.
3. Ignoring Risk Management
- Not using stop-loss orders to limit losses.
- Risking too much capital on a single trade.
- Solution: Always define a risk-reward ratio and protect your investment.
4. Chasing Performance
- Buying stocks just because they have recently gone up.
- Ignoring fundamental and technical analysis.
- Solution: Follow a research-backed approach rather than market hype.
5. Revenge Trading
- Trying to recover losses by making impulsive trades.
- Trading emotionally instead of logically.
- Solution: Accept losses and wait for the right trading opportunities.
6. Not Keeping Track of News
- Ignoring economic events that impact the market.
- Trading without considering major announcements.
- Solution: Stay updated with financial news and market trends.
7. Lack of Patience
- Closing trades too early out of fear.
- Not waiting for the right setup before entering a trade.
- Solution: Trust your strategy and allow your trades to play out.
8. Failing to Adapt
- Sticking to outdated strategies without adjusting to market conditions.
- Ignoring new trends and technologies.
- Solution: Be flexible and refine strategies based on market shifts.
9. Not Using a Trading Journal
- Failing to track past trades and learn from mistakes.
- Not analyzing what works and what doesn’t.
- Solution: Keep a trading journal to improve decision-making and recognize patterns.
10. Overconfidence
- Thinking you can predict the market perfectly.
- Ignoring risk and taking unnecessary chances.
- Solution: Stay humble and continue learning from the market.
11. Assumption-Based Entries
- Entering trades based on predictions instead of clear signals.
- Solution: Always rely on analysis (technical or fundamental) before making a trade.
12. Not Following Own Setup
- Ignoring your tested trading strategy and making impulsive trades.
- Solution: Stick to a strategy that suits your risk appetite and market conditions.
13. Fear
- Fear of losing can make traders exit early or avoid good trades.
- Solution: Accept that losses are part of trading. Maintain confidence in your strategy.
14. Greed Targets
- Holding positions for unrealistic profits, leading to reversals and losses.
- Solution: Set achievable targets and take profits at planned exit levels.
15. Not Following Stop-Loss
- Holding onto losing trades, hoping for a reversal.
- Solution: Use a stop-loss for every trade to protect your capital.
16. Overthinking
- Analyzing too much and missing trade opportunities.
- Solution: Follow a simple, clear trading plan to execute trades confidently.
17. Not Using Limit Orders for Entries
- Entering positions at market prices without controlling slippage.
- Solution: Use limit orders to get favorable entry points without sudden price movements.
18. Not Creating Own Rules and Conditions
- Trading without a clear set of guidelines and risk parameters.
- Solution: Define your entry, exit, risk management, and market conditions before trading.
19. Taking Entries Before Indicator Signals
- Entering trades too early, leading to losses from false signals.
- Solution: Wait for proper confirmation from indicators before executing a trade.
20. Frequently Changing Setup and Parameters
- Constantly tweaking strategies, leading to inconsistency.
- Solution: Backtest and optimize a strategy, then follow it consistently.
21. Making Incorrect Decisions Due to Personal Problems
- Emotional stress affecting decision-making and risk management.
- Solution: Trade with a clear mind and avoid trading during emotionally turbulent times.
22. Ignoring Market Sentiment
- Failing to analyze whether the overall market is bullish, bearish, or sideways.
- Solution: Understand market trends, investor sentiment, and macroeconomic conditions before trading.
23. Trading Too Large Positions
- Overleveraging capital, which can lead to heavy losses.
- Solution: Trade within safe limits based on your account size and risk tolerance.
24. Not Reviewing Past Trades
- Making the same mistakes repeatedly due to a lack of analysis.
- Solution: Regularly review trades, analyze patterns, and refine strategies accordingly.
25. Ignoring Time Frames
- Using short-term charts for long-term trading, leading to incorrect entries.
- Solution: Choose a time frame that aligns with your trading strategy and objectives.
26. Misusing Indicators
- Relying on too many indicators, leading to confusion and overcomplicated analysis.
- Solution: Use a few well-tested indicators that complement each other instead of overcrowding charts.
27. Not Understanding Liquidity
- Trading low-volume stocks that can lead to price manipulation and difficulty exiting positions.
- Solution: Always check liquidity levels to ensure smooth buying and selling.
28. Holding onto Loss-Making Positions for Too Long
- Refusing to accept losses, hoping for a turnaround, which may never come.
- Solution: Cut losses early and reallocate capital to better opportunities.
29. Trading Based on Social Media Hype
- Entering trades based on trending news or influencers without research.
- Solution: Always verify information with independent analysis rather than blindly following social media tips.
30. Not Taking Breaks
- Constantly monitoring charts can lead to mental exhaustion, resulting in poor decision-making.
- Solution: Take breaks to refresh your mindset and approach trading with a clear perspective.
31. Trading Without a Clear Exit Strategy
- Holding positions without a predefined profit-taking or stop-loss strategy.
- Solution: Define exit points for both winning and losing trades before entering a position.
32. Ignoring Trading Psychology
- Letting emotions dictate trading decisions instead of logic and analysis.
- Solution: Maintain emotional discipline, control fear, and avoid impulsive trades.
33. Over-Reliance on Signals or Bots
- Blindly following automated signals or trading bots without understanding market conditions.
- Solution: Use signals as tools, but verify them with personal analysis before executing trades.
34. Not Understanding Margin and Leverage Risks
- Using high leverage without considering the impact of market fluctuations.
- Solution: Trade with leverage cautiously, ensuring risk management strategies are in place.
35. Neglecting Portfolio Diversification
- Investing only in a single asset or sector, increasing risk exposure.
- Solution: Diversify investments across different sectors and asset classes to reduce risk.
36. Misinterpreting News and Market Events
- Reacting too quickly to news without considering its long-term impact.
- Solution: Analyze news carefully, consider market sentiment, and avoid emotional reactions.
37. Failing to Recognize Manipulation in Markets
- Trading small-cap or illiquid stocks prone to manipulation.
- Solution: Avoid stocks with unusual trading patterns or excessive volatility due to manipulation.
38. Not Learning from Mistakes
- Repeating errors instead of adapting and improving strategies.
- Solution: Keep a trading journal, analyze past trades, and refine approaches based on lessons learned.
39. Relying Too Much on One Trading Style
- Sticking to a single strategy and failing to adapt to market conditions.
- Solution: Learn multiple trading styles and adjust them based on different market trends.
40. Trading Against the Trend
- Entering trades that go against the market direction, leading to increased risks.
- Solution: Follow the dominant trend and avoid taking contrarian trades without strong confirmation
41. Trading Without Considering Transaction Costs
- Ignoring brokerage fees, slippage, and taxes, which impact overall profits.
- Solution: Factor in all transaction costs when planning trades and avoid unnecessary trades that reduce net gains.
42. Not Understanding Market Liquidity
- Trading stocks or assets with low liquidity, making it difficult to exit positions.
- Solution: Trade high-liquidity stocks to ensure smooth buying and selling.
43. Following Herd Mentality
- Entering trades based solely on what others are doing instead of research.
- Solution: Develop independent analysis and avoid blindly following social media or group trends.
44. Holding Positions Without a Time-Based Exit Strategy
- Staying in trades for too long without reassessing market conditions.
- Solution: Define time-based exits to reassess whether a position is still valid.
45. Mismanaging Position Sizing
- Using inconsistent position sizing, leading to uneven risk exposure.
- Solution: Follow a structured risk-management approach and define position sizes based on account capital.
46. Overcomplicating Strategies
- Adding too many indicators, creating confusion instead of clarity.
- Solution: Stick to simple and effective trading setups that match market conditions.
47. Misinterpreting Volume Trends
- Ignoring volume data, leading to poor trade entries and exits.
- Solution: Monitor volume trends to confirm price movements and avoid false breakouts.
48. Trading Without Setting Realistic Expectations
- Expecting quick wealth without understanding market fluctuations.
- Solution: Approach trading with patience and realistic return expectations.
49. Ignoring Broker Reliability
- Choosing unreliable brokers with poor execution speed or hidden charges.
- Solution: Research and select brokers with transparent fees and reliable service.
50. Not Having a Backup Plan for Market Crashes
- Failing to prepare for extreme market conditions.
- Solution: Use hedging strategies, diversify investments, and keep emergency stop-loss plans.
51. Getting Stuck in Biased Views
- Holding onto a bullish or bearish mindset without reassessing market conditions.
- Solution: Stay flexible and adapt your strategy based on market trends.
52. Not Understanding the Importance of Timeframes
- Using short-term charts for long-term trades or vice versa.
- Solution: Choose a timeframe that aligns with your strategy and objectives.
53. Relying Too Much on One Indicator
- Making trades based only on a single indicator without confirming signals.
- Solution: Use multiple indicators for better accuracy, but avoid overcomplication.
54. Not Practicing Enough Before Live Trading
- Jumping into real-money trades without enough paper trading experience.
- Solution: Practice with demo accounts or small capital before scaling up.
54. Trading Based on Hope Instead of Logic
- Holding onto bad trades, hoping the price will reverse magically.
- Solution: Follow strict risk management and exit strategies based on facts.
Avoiding these mistakes can significantly improve your trading success! Stay disciplined, follow a solid strategy, and manage emotions effectively.
Affiliate Program For Indian YouTubers Only
Recurring Commission 15%
Get Paid Every Month
Referrals stay yours forever
About Us
AV Indicators was born out of a passion for trading and a mission to redefine market analysis. Founded by dedicated traders and technology enthusiasts, we specialize in crafting advanced Pine Script indicators that empower traders worldwide. Our tools leverage precision technology to deliver highly accurate market predictions and innovative pattern recognition. With a global vision, we cater to traders across different markets and skill levels, ensuring seamless trading experiences. Committed to continuous innovation, we refine our strategies to enhance decision-making and maximize efficiency. More than just a product, we are your strategic partner in achieving financial success. Our indicators provide actionable insights, improve chart analysis, and optimize trading performance. At AV Indicators, technology meets trading excellence, transforming every trader’s journey. Join us and elevate your trading business with advanced solutions. Your success starts here.
DESCLAIMER
Do your Own Research
Our content is intended to be used and must be used for informational purposes only. It is very important to do your own analysis before making any investment based on your own personal circumstances. You should take independent financial advice from a professional in connection with, or independently research and verify, any information that you find on our Website and wish to rely upon, whether for the purpose of making an investment decision or otherwise.
No Investment Advice
We are an educational forum for analyzing, learning & discussing general and generic information related to stocks, investments, and strategies. No content on the site constitutes – or should be understood as constituting – a recommendation to enter in any securities transactions or to engage in any of the investment strategies presented in our site content. We do not provide personalized recommendations or views as to whether a stock or investment approach is suited to the financial needs of a specific individual.